BY MARTIN IKE-MUONSO
The decision by the Advertising Practitioners Council of Nigeria (APCON) to develop a set of rules to govern the behaviour of the advertising market participants is highly commendable. There is no doubt that the industry will do much better ‘ceteris paribus’, if it follows through with some of the measures it has put in place. Nevertheless, for this outcome expectation to be a thorough reality, the regulator may need to pay attention to three elements in the AISOP document, which it is about to sign into effect by January 2022.
These three factors include:
- The horizontal price-fixing of pitch fee, which has enormous anticompetition and market shrinking consequences
- The double charging of advertisers using a system of a primary pitch fee and a secondary rejection fee which when combined in a single transaction over bloat advertising transaction costs.
- APCON’s planned interference in the setting up of the terms and conditions defining contracts between market participants.
To demonstrate the damaging effects of the horizontal price-fixing behaviour in the advertising industry, we have used a simple model that captures the overcharging size at the primary pitch fee level. The model shows, albeit retrospectively, what the magnitude of damage would have been to the volume of above-the-line advertising expenditure in the last seven years if this policy was in operation.
Advertisement
Advertising industry performance since 2014
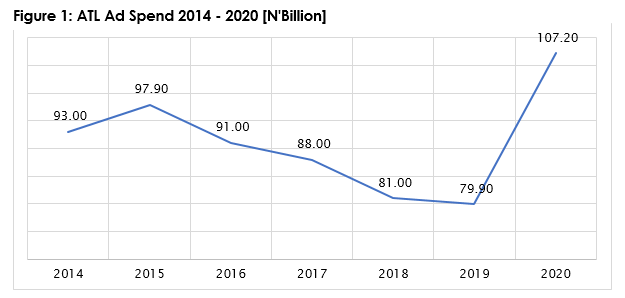
The Media monitoring services data showed that the total above the line [ATL] expenditure exceeded N100 billion in 2020. The closest it was to this reference line in the past seven years was in 2015. The ATL advertising expenditure that year was approximately N97.9 billion. It, however, dropped consistently afterwards, to N79.9 billion in 2019 (see figure 1). Perhaps, the troubling half-a-decade persistent decline in the volume of ATL advertising expenditure might have contributed to the regulator’s decision to inject morsels of market sanitising measures to improve its efficiency. Second, it is pretty evident from the data that the potentials of the advertising industry are sub-optimised and goes back to justify the recent actions of the regulator.

Advertisement
Source: The Media Monitoring Services
A consideration of the breakdown of media channels shows that the television medium remains dominant and accounts for more than 50% of the expenditure in 2020. The average share of the TV channel in the overall ATL expenditure was approximately 37% until 2019. The sudden jump to 52% in 2020 was perhaps due to the COVID-19 pandemic that seems to have considerably improved people’s choice of television more than radio, outdoor advertising and the press. Table 1 presents a breakdown of the ATL expenditure from 2014 to 2020.
Table 1: Share [%] of media channels in the ATL expenditure
| Year | 2014 | 2015 | 2016 | 2017 | 2018 | 2019 | 2020 |
|---|---|---|---|---|---|---|---|
| TV | 37% | 40% | 35% | 38% | 36% | 34% | 52% |
| Radio | 13% | 15% | 14% | 14% | 12% | 14% | 13% |
| Outdoor | 22% | 21% | 32% | 28% | 26% | 27% | 15% |
| Press | 28% | 24% | 20% | 20% | 26% | 25% | 20% |
| Ad Spend (N’ billion) | 93.0 | 97.9 | 91.0 | 88.0 | 81.0 | 79.9 | 107.2 |
Source: The Media Monitoring Services
Advertisement
Advertising, national economic growth and diversification
Through its expansion of consumer choices, advertising pushes the frontiers of aggregate demand and production in an economy. This role is reciprocally reinforcing as economic growth propels further advertising activities. The exact process leads to economic diversification when the advertising industry becomes more competitive and innovative.
Enhanced competition and consequently innovation and growth drive down advertising costs and prices, leading to the increased consumption of advertising services. That is one of the areas where the regulator steps in. Its role in this process beyond the regulation of fraudulent and deceptive messages is to promote better functioning of the market. This expectation is inconsistent with every regulatory attempt to tamper with the market determination of prices and contractual understanding between participants in the market.
Simplified model of damages caused by price-fixing
Advertisement
Economists, development experts and competition specialists have long recognised the destructive impacts of price-fixing in the market. To demonstrate this, we asked a fundamental question: how much damage to the ATL advertising spend since 2014 would have taken place if APCON implemented the currently suggested horizontal price-fixing arrangement over those years.
To conduct this simplified estimation, we collected data on the average pitch fees paid by the twenty largest firms across five sectors since 2013. These prices constitute our reference prices or pitch fees. The core of the estimation is to determine the size of the overcharge, which is essentially the difference between the paid fee minus the reference fee. This difference is then multiplied by the quantity demanded.
Advertisement
For simplicity and to determine the effect on the size of advert spend, we assumed that each billion naira of spending an advert is equal to 500 units of advertising service consumed. To keep the model as simple as possible, we refrained from calculating the deadweight effects based on the consumer surplus and the added adverse impact of double charging. Table 2 summarises the minimum damage size done to ATL advertising services consumption.
Table 2: Economic loss due to pitch-fee fixing
Advertisement
| Year | Average effective pitch fee | AdSpend/units | Economic loss [N’bn] Pitch fee = N1 m |
Economic loss [N’bn]
Pitch fee = N2 m |
|---|---|---|---|---|
| 2014 | 750,000.00 | 46,500.00 | -11.625 | -58.125 |
| 2015 | 1,100,000.00 | 48,950.00 | 4.895 | -44.055 |
| 2016 | 800,000.00 | 45,500.00 | -9.1 | -54.6 |
| 2017 | 1,200,000.00 | 44,000.00 | 8.8 | -35.2 |
| 2018 | 900,000.00 | 40,500.00 | -4.05 | -44.55 |
| 2019 | 900,000.00 | 39,950.00 | -3.995 | -43.945 |
| 2020 | 750,000.00 | 53,600.00 | -13.4 | -67 |
Source: ValueFronteira Research 2021
Advertisement
Table 2 shows that if the N2 million pitch fee were in effect in 2014, the ATL segment of the industry would have lost N58.1 billion in damaged value. The damage size would also have been N67 billion in 2020. It would have also been N13.4 billion if the pitch fee was N1 million in the same year. Imagine the size of these naira losses if we include APCON’s recommended double charge for pitch rejection in this simplistic model.
Conclusion
The advertising industry regulator’s courageous move to reform the industry is entirely laudable and deserves all stakeholder support. Nevertheless, APCON needs to bend backwards and reconsider the dangerous steps it is taking in these early stages by interfering in the free functioning of the market. Regulators in all progressive societies and markets consider this infringement retrogressive.
On the contrary, the focus is on ensuring that the market system enjoys tremendous data availability for quick and robust decision-making by the participants in the marketplace. This market promoting route is the pathway that we suggest the regulator urgently takes.
Ike-Muonso is the founder of ValueFronteria, a business data-backed research institute and consults for governments of different countries
Views expressed by contributors are strictly personal and not of TheCable.
Add a comment


