Purple Real Estate Income Plc (‘Purple Group’ or ‘Purple’ or ‘PREIP’ or ‘The Group’) has announced its unaudited results for the nine months ended 30 September 2022.
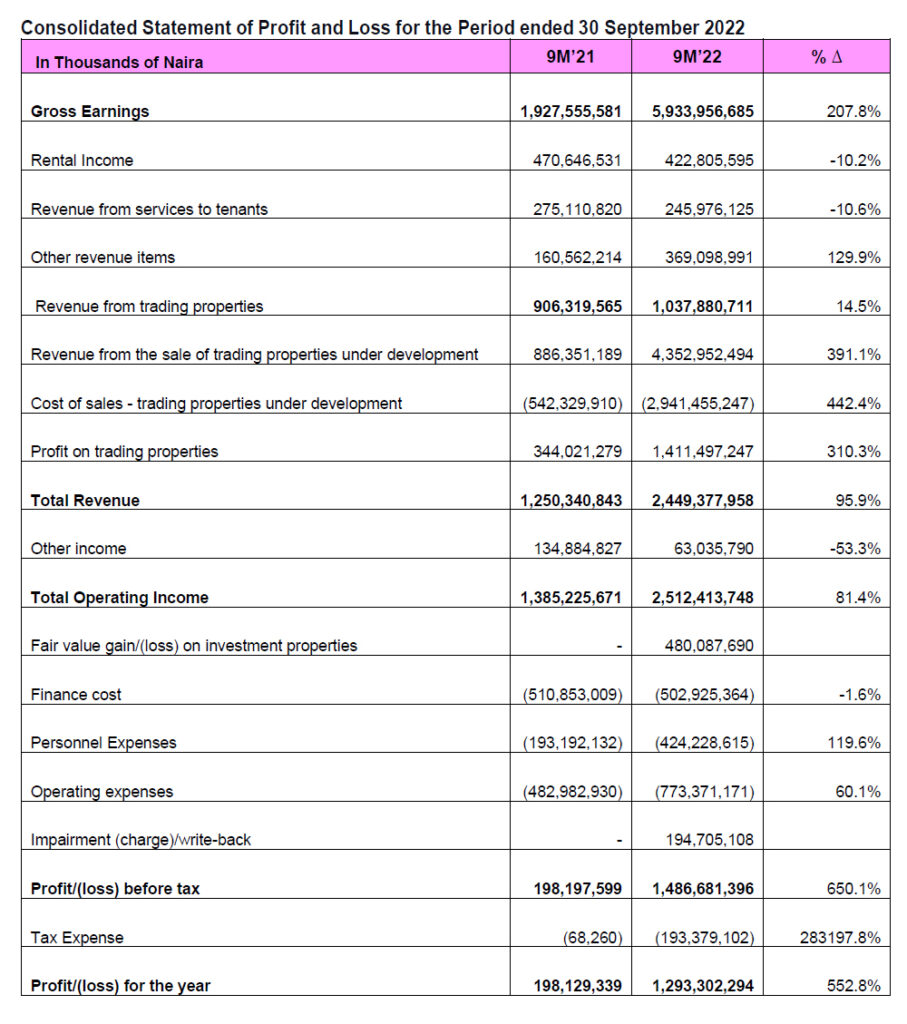
Consolidated Statement of Profit or Loss
- Gross earnings of N5.9 billion, up 207.8% year-on-year (9M 2021: N1.9 billion)
- Net revenue of N2.5 billion, up by 95.9% year-on-year (9M 2021: N1.3 billion)
- Total other income of N63.0 million (9M 2021: N134.9 million)
- Total operating income grew by 81.4% to N2.5 billion year on year (9M 2021: N1.4 billion)
- Adjusted operating expenses1 grew by 48.3% to N1.0 billion year-on-year (9M 2021: N676.2 million)
- EBITDA of N2.0 billion, up by 175.0% year-on-year (9M 2021: N738.9 million)
- Operating profit (or EBIT) of N1.9 billion, up 181.09% year-on-year (9M 2021: N709.1 million)
- Profit before tax of N1.5 billion, up by 650.1% year-on-year (9M 2021: N198.2 million)
- Profit after tax of N1.3 billion up 552.7% year-on-year (9M 2021: N198.1 million)
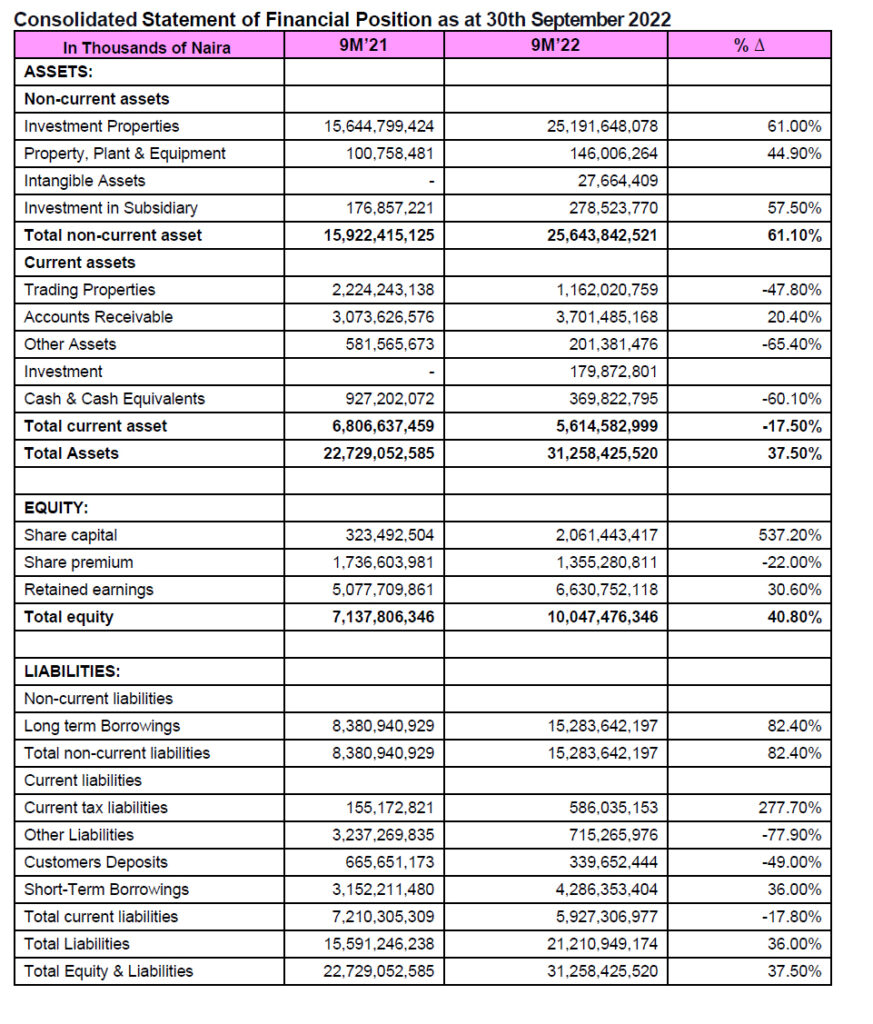
Consolidated Statement of Financial Position
- Total assets increased by 18.3% to ₦31.3 billion year-to-date (FY 2021: ₦26.4 billion)
- Total liabilities of ₦21.2 billion, up 21.8% year-to-date (FY 2021: ₦17.4 billion)
- Shareholders’ funds of ₦10.0 billion (FY 2021: ₦9.0 billion)
Key Ratios
- Net revenue margin of 41.3% (9M 2021: 64.9%)
- Cost-to-income of 39.9% (9M 2021: 8%)
- EBITDA margin of 37.6% (9M 2021: 2%)
- Operating profit margin of 36.9% (9M 2021: 5%)
- Profit before tax margin of 27.6% (9M 2021: 0%)
- Leverage ratio of 2.0x (FY 2021: 1x)
Commenting on the performance, the Chief Executive Officer, Mr Laide Agboola, stated:
“The strong performance in the second quarter of 2022 has been reinforced by our third quarter’s performance, and we have maintained very good momentum in practically all of our key measures as a result. Operationally, we expanded our clientele base and progressed on our core and peripheral business lines.
As a Company with multiple revenue streams spanning principal investment, financial services, private equity, real estate and lifestyle development – which blends retail, family fun, e-commerce, entertainment, food and drinks, co-working, and accommodation. We are committed to investing heavily in the growth and improvement of our platform, leveraging technology and partnerships, and continuously enhancing the quality of service we provide to our clients to drive long-term sustainability.
Financial Review
Gross earnings of: N5.9 billion, up by 207.8% (9M 2021: N1.9 billion). A key driver of gross earnings growth was income earned from trading properties under development (73.4% of gross earnings) which grew year-on-year by 391.1% to N4.4 billion (9M 2021: N886.4 million; 16.9% of gross earnings).
Other drivers of gross earnings include:
- Rental income (7.1% of gross earnings) of N422.8 million (9M 2021: N470.6 million), lower by 10.2% as a result of concessions given to tenants to help alleviate the adverse economic conditions in the
- Revenue from services to tenants (4.1% of gross earnings) declined by 6% to N246.0 million from N275.1 million in 9M 2021 driven by the rise in diesel and electricity rates in 2022.
- Total other income (1.1% of gross earnings) fell by 53.3% to N63.0 million from N135.0 million recorded in 9M 2021 driven by a reduction in income from development management and outsourced /shared services year-on-year
- Fair value gain of N480.1 million (8.1% of gross earnings)
Net revenue grew by 95.9% to N2.4 billion in 9M 2022 (9M 2021: N1.2 billion), primarily on account of higher revenue recorded on trading properties under development. Additionally, throughout the period, the cost of sales rose significantly with rising material costs as a result of disruptions in the global supply chain and unfavourable exchange rate movement. Specifically, the cost of sales from trading properties under development rose by 442.4% to N2.9 billion (9M 2021: N542.3 million) Overall, this resulted in a net revenue margin of 41.3% in 9M 2022 (9M 2021: 64.9%).
Adjusted operating expenses of ₦1.0 billion (16.9% of gross earnings) grew by 48.3% (9M 2021: ₦676.2 million) resulting from increased operational activities and personnel expenses. Personnel expenses rose 120.0% to ₦424.2 million (9M 2021: ₦193.1 million). Overall, the Group recorded an improvement in its cost-to-income to 39.9%, down by 889.6 basis points (9M 2021: 48.8%), benefitting from faster growth in net operating income relative to the increase in adjusted operating expenses year-on-year.
EBITDA increased by 175.0% to ₦2.0 billion from ₦738.9 million reported in 9M 2021. Depreciation for property and equipment increased by 33.8% to ₦40.0 million (9M 2021: ₦29.9 million). The Group’s EBITDA margin declined to 26.2% year-on-year from 38.3%, reflective of the significant increase in the cost of sales due to the growth in business activity and generally high prices.
Operating profits increased by 180.6% to ₦1.98 billion from ₦709.1 million in the year-ago period. The operating profit margin of 36.9% relative to 39.5% in 9M 2021 is reflective of the trickle-down impact of better margins from sales recognised from development assets
Finance costs dropped marginally by 1.6% to ₦502.9 million (9M 2021: ₦510.9 million), driven largely by interest expense on facilities with an interest coverage ratio of 4.0x (9M 2021: 1.4x)
Profit before tax rose by 650.1% to ₦1.5 billion (9M 2021: ₦198.2 million) driven largely by higher revenue from increased activities, resulting in a Profit before tax margin of 17.0% (9M: 2021: 10.3%).
The Group recorded an effective tax rate of 13.0% (9M 2021: 0.0%) due to higher operating profit. Profit after tax of ₦1.3 billion, up by 310.4% from ₦198.1 million reported in 9M 2021. The growth was due to an increase in gross earnings which resulted from higher activity levels and revenue from sales.
Year-to-date, total assets grew by 18.3% to ₦31.3 billion (FY 2021: ₦26.4 billion). The growth in non- current assets to ₦25.6 billion (FY 2021 ₦17.3 billion) was driven by a 47.9% growth in investment property to ₦25.2 billion (FY 2021: ₦17.0 billion). Current assets declined by 38.5% to ₦5.6 billion (FY 2021: ₦9.1 billion) driven largely by a reduction in trading properties under development and cash and cash equivalent balance which fell by 83.0% and 81.2% to ₦1.2 million (FY 2021: ₦6.8 million) and ₦370.0 million (FY 2021: ₦2.0 billion) respectively.
Shareholders’ funds increased to ₦10.0 billion from ₦9.0 billion due to a 59.3% increase in share capital to ₦2.1 billion (FY 2021: ₦1.3 billion) while share premium increased by 116.6% to ₦1.4 billion (FY 2021: ₦625.6 million).
Total liabilities grew by 21.8% to ₦21.2 billion from ₦17.4 billion in FY 2021, driven by an 84.5% increase in total borrowings to ₦19.6 billion (FY 2021: ₦15.6 billion) and 64.3% growth in current tax liabilities to ₦586.0 million from ₦356.7 million in FY 2021.
A significant portion of Purple’s debt is comprised of long-term borrowings, which increased by 84.5% to ₦15.3 billion from FY 2021’s reported total of ₦8.3 billion. This is indicative of the type of financing most suited to Purple’s real estate business, while short-term borrowings, which made up 29.1% of the total borrowings, fell by 41.2% year-to-date to ₦4.3 billion (FY 2021: ₦7.3 billion). This resulted in a year-to-date leverage ratio of 2.0x (FY 2021: 2.1x).
For investor inquiries, please contact:
Investor Relations [email protected]
Olayinka Sodipe Oluyemisi Lanre-Phillips [email protected]
For media inquiries, please contact: Emmanuel Balogun at [email protected]
Follow Purple on Facebook: Purple Instagram:@Purplegroupng LinkedIn: Purple
About Purple
Purple is Nigeria’s breakthrough real estate and financial services platform at the forefront of a real estate revolution. We invest in the development, management, and acquisition of superior multi- purpose properties and infrastructure across a wide range of sectors to democratise access to real estate ownership and investment, breaking down the barriers that prevent investors from the gains of appreciating assets.
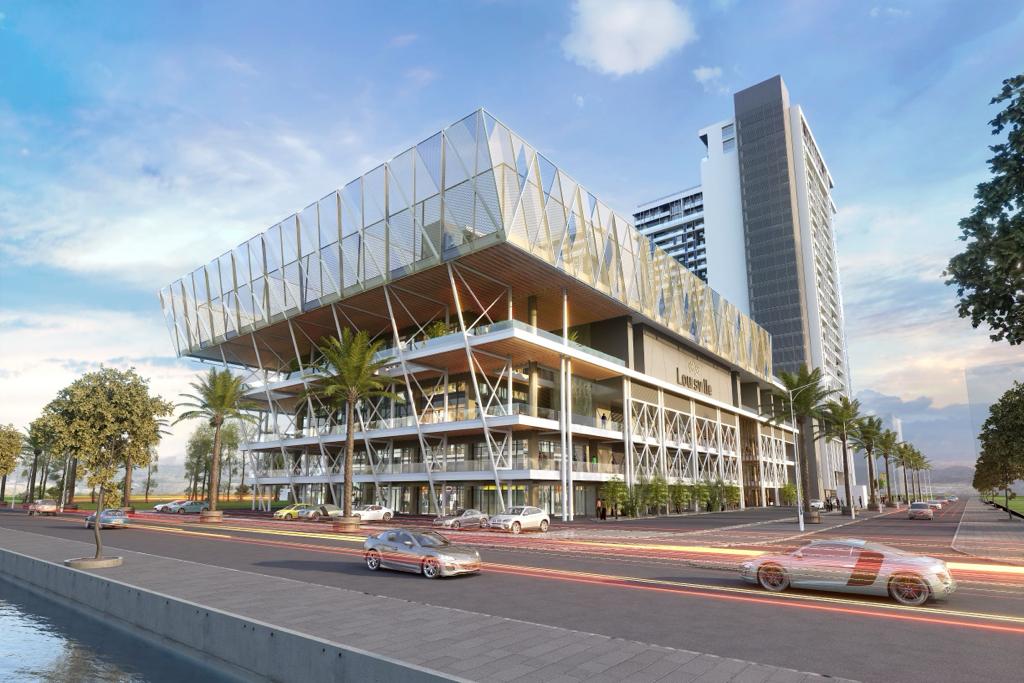
Purple Real Estate Income Plc commenced operations in 2014 and is responsible for developing the Maryland Mall, a Grade-A mixed-use centre that boasts the largest outdoor LED screen in West Africa.
To discover more and join the Purple community, visit Purple.xyz
Disclaimer
This announcement contains or will contain forward-looking statements that reflect management’s expectations regarding the Company’s future growth, results of operations, performance, business prospects and opportunities. Wherever possible, words such as “anticipate”, “believe”, “expects”, “intend” “estimate”, “project”, “target”, “risks”, “goals” and similar terms and phrases have been used to identify the forward-looking statements. These statements reflect management’s current beliefs and are based on information currently available to management. Certain material factors or assumptions have been applied in drawing the conclusions contained in the forward-looking statements. These factors or assumptions are subject to inherent risks and uncertainties surrounding future expectations generally.
Purple Group cautions readers that several factors could cause actual results, performance, or achievements to differ materially from the results discussed or implied in the forward-looking statements. These factors should be considered carefully, and undue reliance should not be placed on forward-looking statements. For additional information concerning these risks or factors, reference should be made to the Company’s disclosure materials filed from time to time with the Securities & Exchange Commission in Nigeria. The Company disclaims any intention or obligation to update or revise any forward-looking statements, whether because of new information, future events or otherwise.
Definition of terms
- Gross earnings: computed as an aggregate of revenue from the sale of trading properties under development, rental income, revenue from services to tenants and total other
- Total cost of sales: comprised cost of sales from trading properties under development, expenses on services to tenants, other operating expenses and total income added back
- Net revenue: computed by deducting the total cost of sales from gross earnings
- Adjusted Operating expenses: computed by deducting finance cost from total expenses
- Net operating income: derived by aggregating net revenue and total other income
- EBITDA: derived by adding back depreciation for property and equipment to operating profit
- Operating profit/EBIT: computed by adding back finance cost to profit before minimum tax and income tax expense
- Interest coverage ratio: computed as operating profit divided by finance cost
- Cost-to-Income: derived by dividing total operating cost by net operating income
- Net revenue margin: obtained by dividing net revenue by gross earnings
- EBITDA tax margin: as a ratio of EBITDA and gross earnings
- Operating profit margin: derived as a ratio of operating profit and gross earnings
- Profit before tax margin: as a ratio of operating profit and gross earnings
- Leverage ratio: computed as the ratio of total debt and total equity
- Total borrowings derived as an aggregate of short-term borrowings and long-term borrowings
Add a comment


