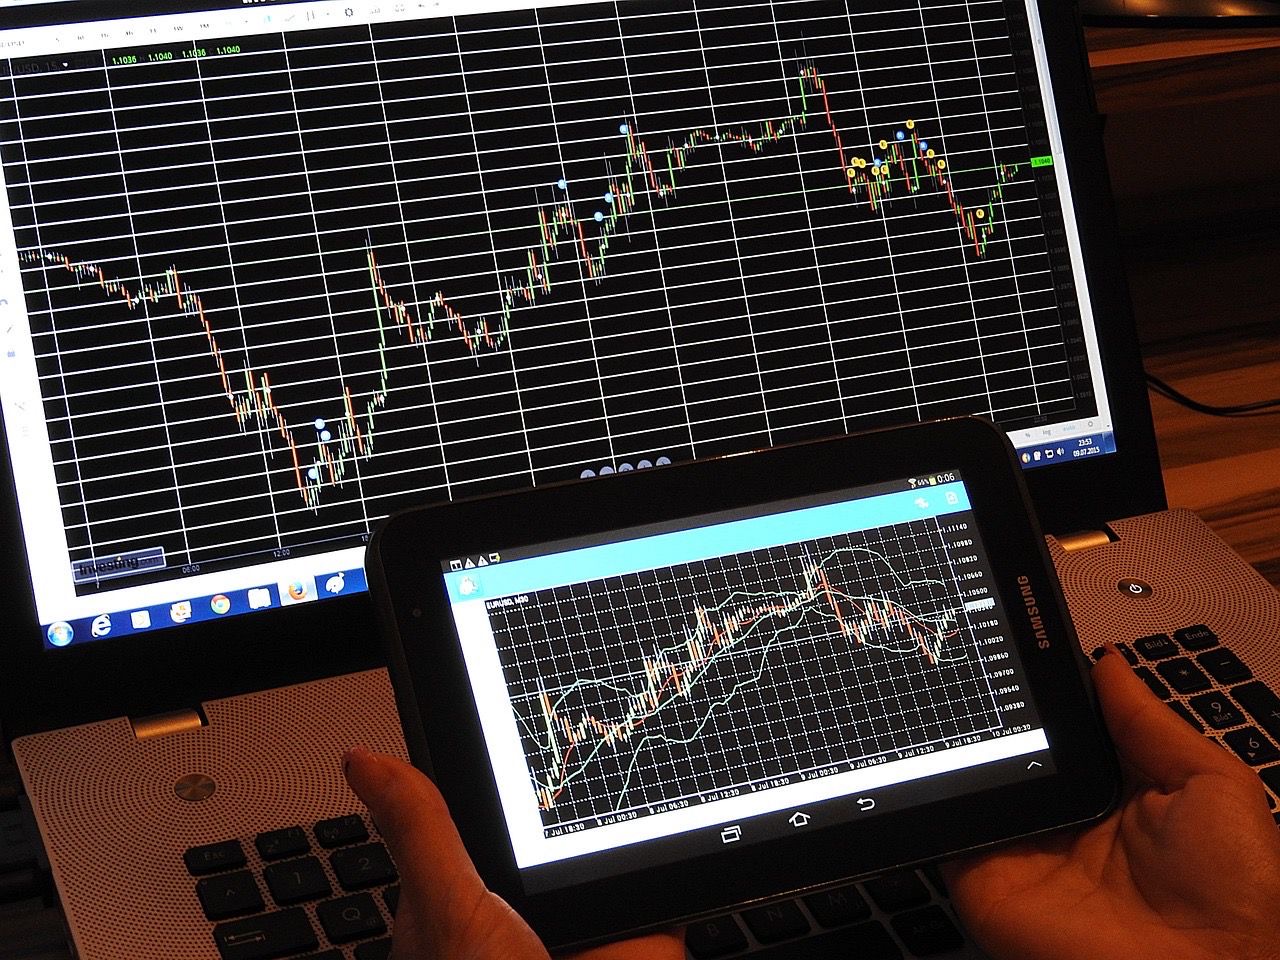
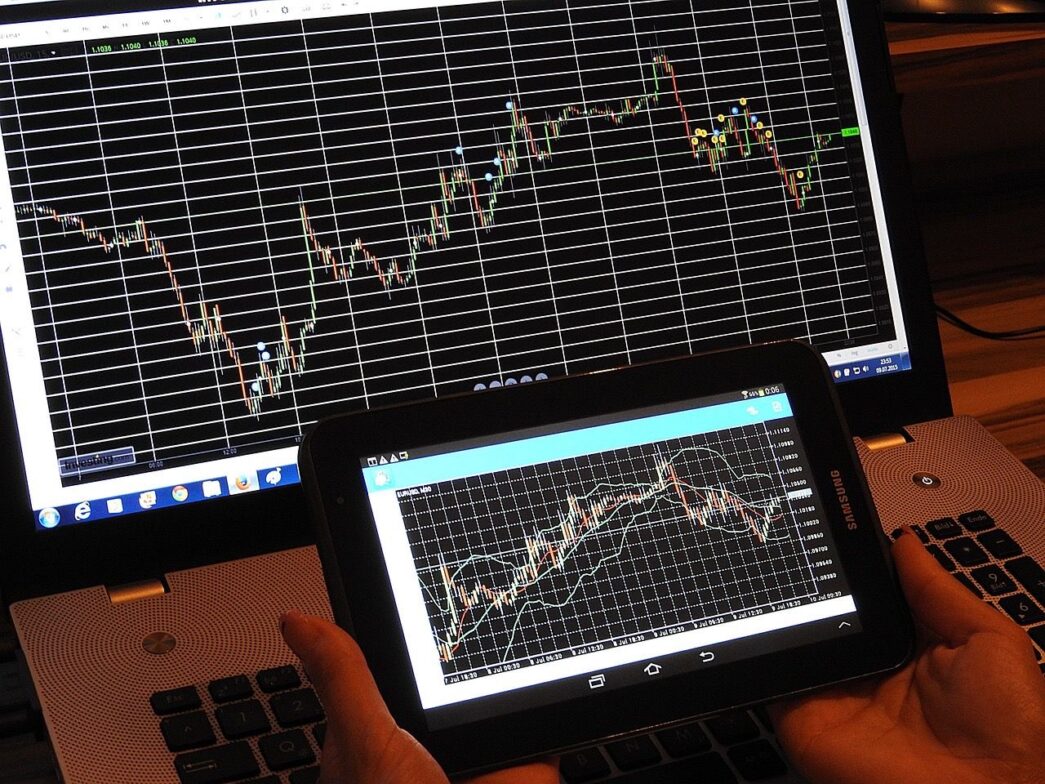
In forex trading, mastering technical indicators can make a world of difference. Beyond basic tools, advanced indicators offer traders the precision needed to spot new opportunities and manage risk effectively. With the right insights, you can fine-tune your trading strategies and take your trading experience to the next level. HFM provides the resources to deepen your understanding of these advanced tools, helping you make confident, informed trading decisions.
Understand Trend Strength with the ADX Indicator
The Average Directional Index (ADX) measures the strength of a trend, helping traders know when a trend is strong enough to trade with confidence. The ADX oscillates between 0 to 100, with readings above 25 signaling a strong trend. When the ADX line is rising, it shows an increasing trend strength. When falling, it signals a weakening trend. Traders can use the ADX to only trade with the major trend and avoid choppy market conditions.
Identify Volatility with Bollinger Bands
Bollinger Bands envelop price action by plotting a simple moving average with two standard deviation bands above and below. When the bands widen, it signals increasing volatility and possible trend changes. When the bands narrow, it signals decreasing volatility and range-bound conditions. Traders can use Bollinger Bands to gauge periods of high and low volatility in the market. Strategies can be refined around trading breakouts when volatility expands and avoiding choppy conditions when volatility contracts.
Spot Overbought/Oversold Levels with the RSI
The Relative Strength Index (RSI) is a momentum indicator that gauges the magnitude and velocity of price fluctuations. The RSI fluctuates within a range of 0 to 100. Values exceeding 70 suggest prices have risen too far too fast and are overextended, hinting at potential reversals lower. Conversely, levels under 30 imply prices have declined sharply and may be oversold, signaling possible bounce backs higher. Divergence between the RSI and price action can foreshadow turning points in the trend. Analyzing overbought and oversold extremes with the RSI assists traders in identifying opportune moments to enter or exit trades.
Gain Insight with the Ichimoku Cloud
The Ichimoku Cloud uses multiple lines to depict support, resistance, momentum, and trend direction. One of its main signals is the emergence of price above or below the cloud, which indicates a trend change. A wide cloud signals volatile conditions, while a thin cloud signals consolidation. Ichimoku also creates ‘sentiment zones’ that suggest bullish or bearish bias. Mastering Ichimoku provides a multidimensional view of the market environment.
Combine Indicators for Greater Accuracy
While individual indicators provide valuable data, combining indicators can refine techniques by looking for confirmations. For example, only trading breakouts when the ADX shows a strong trend, or entering trades when the RSI aligns with the overall trend. Using indicators together creates robust trading signals and improves accuracy.
Fibonacci Retracement Indicators
Fibonacci retracement levels are one of the most popular advanced indicators used in forex trading. The indicator uses Fibonacci ratios of 23.6%, 38.2%, 50%, and 61.8% to identify potential support and resistance levels. After a significant price movement, traders will watch for a pullback or retracement to these Fib levels. The idea is that price will tend to retrace to certain Fib levels before resuming the original trend. Traders can refine entry techniques using Fib retracements by looking to enter long trades on support at Fib levels during uptrends, and short trades on resistance at Fib levels during downtrends.
Mastering these advanced tools creates more trading opportunities. But success comes down to proper implementation within a structured approach.
Add a comment


